Heartbeat to Visuals
Responsibilities: Signal Capture with Arduino, Particles simulation, Data Pocessing, Data Visualization
Overview
This project was inspired by the challenge of making invisible physiological signals—like the heartbeat—something people can directly perceive. Instead of presenting data as numbers or charts, I translate heartbeat into real-time visuals and sound, making scientific information more intuitive and engaging.
Goals
Accessible Science Communication. I transform physiological data into audiovisual experiences to make scientific concepts tangible through art.
Human-Computer Interaction. I explored heartbeat as a new kind of interface, where the body itself drives interaction with visuals and sound.
Heartbeat Capture
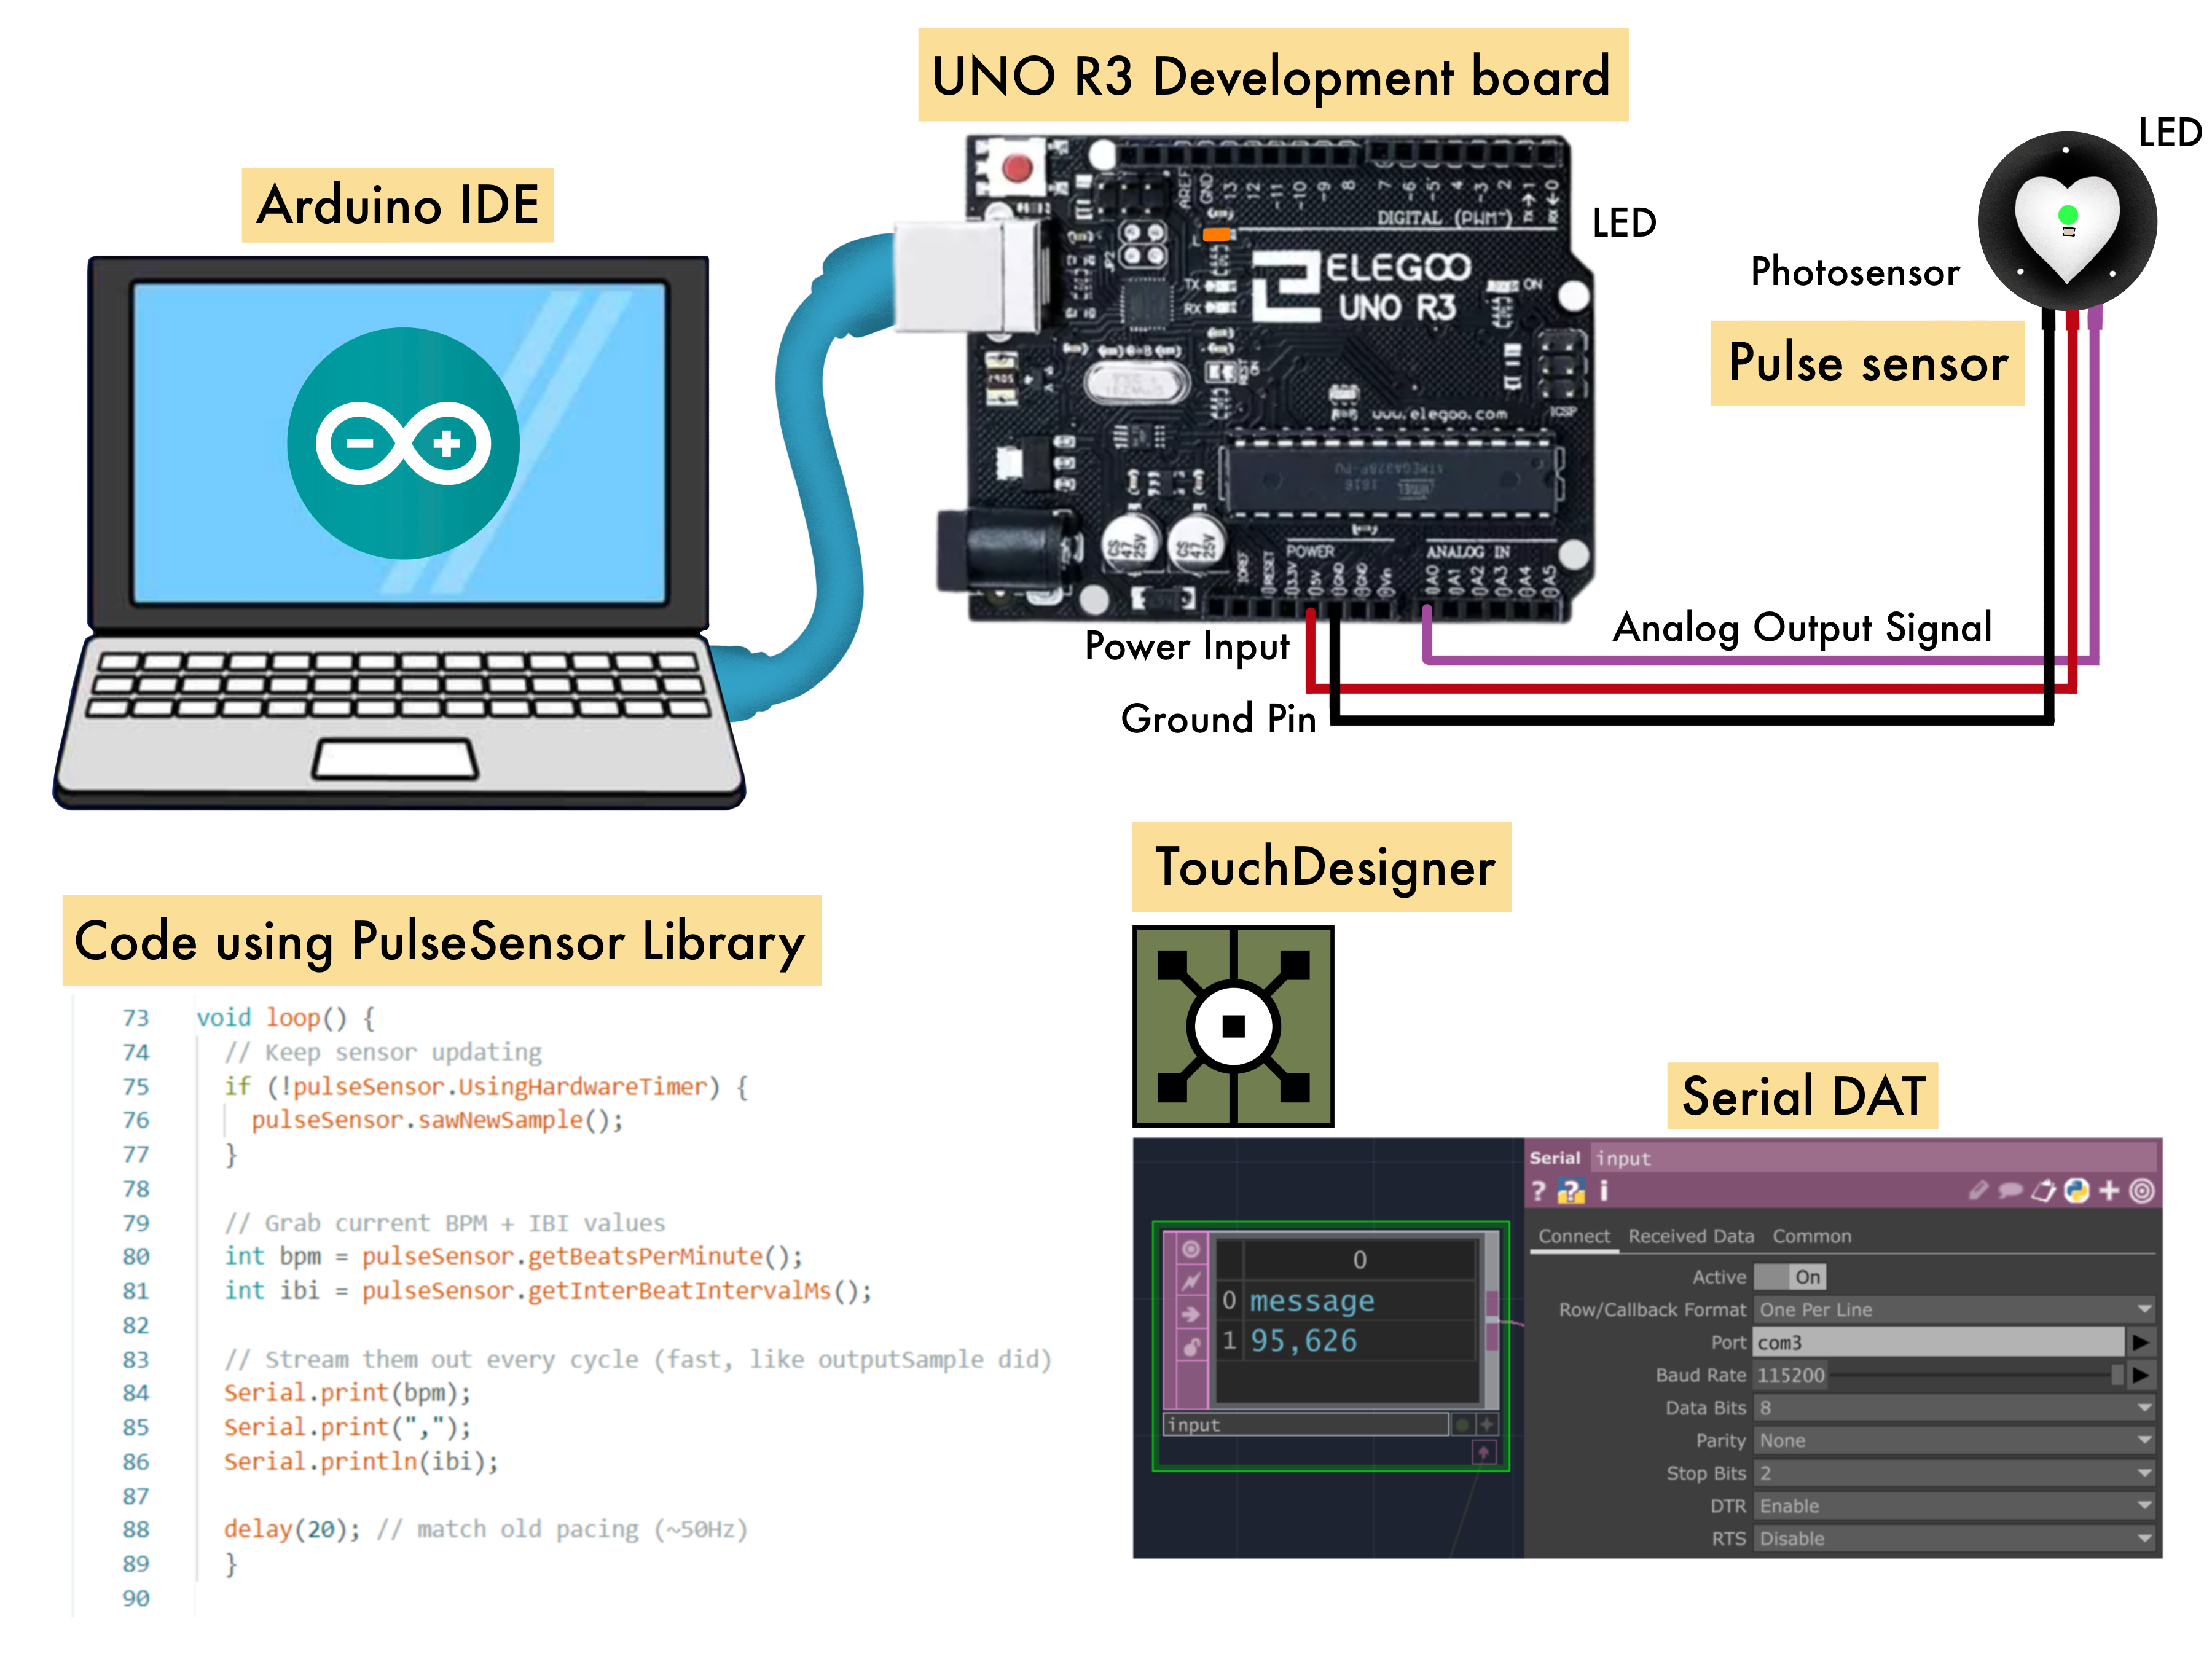
A pulse sensor connected through an Arduino reads the signal, processes BPM and IBI in Arduino IDE, and streams them to the computer. The values are sent over USB as simple data that TouchDesigner can use in real time.
In greater details:
A Pulse Sensor works by shining a green light onto a thin part of your body. When the light travels through your skin, some of it gets absorbed by your blood, and the rest bounces back. The Pulse Sensor has a special part called a photodetector that measures how much light returns.
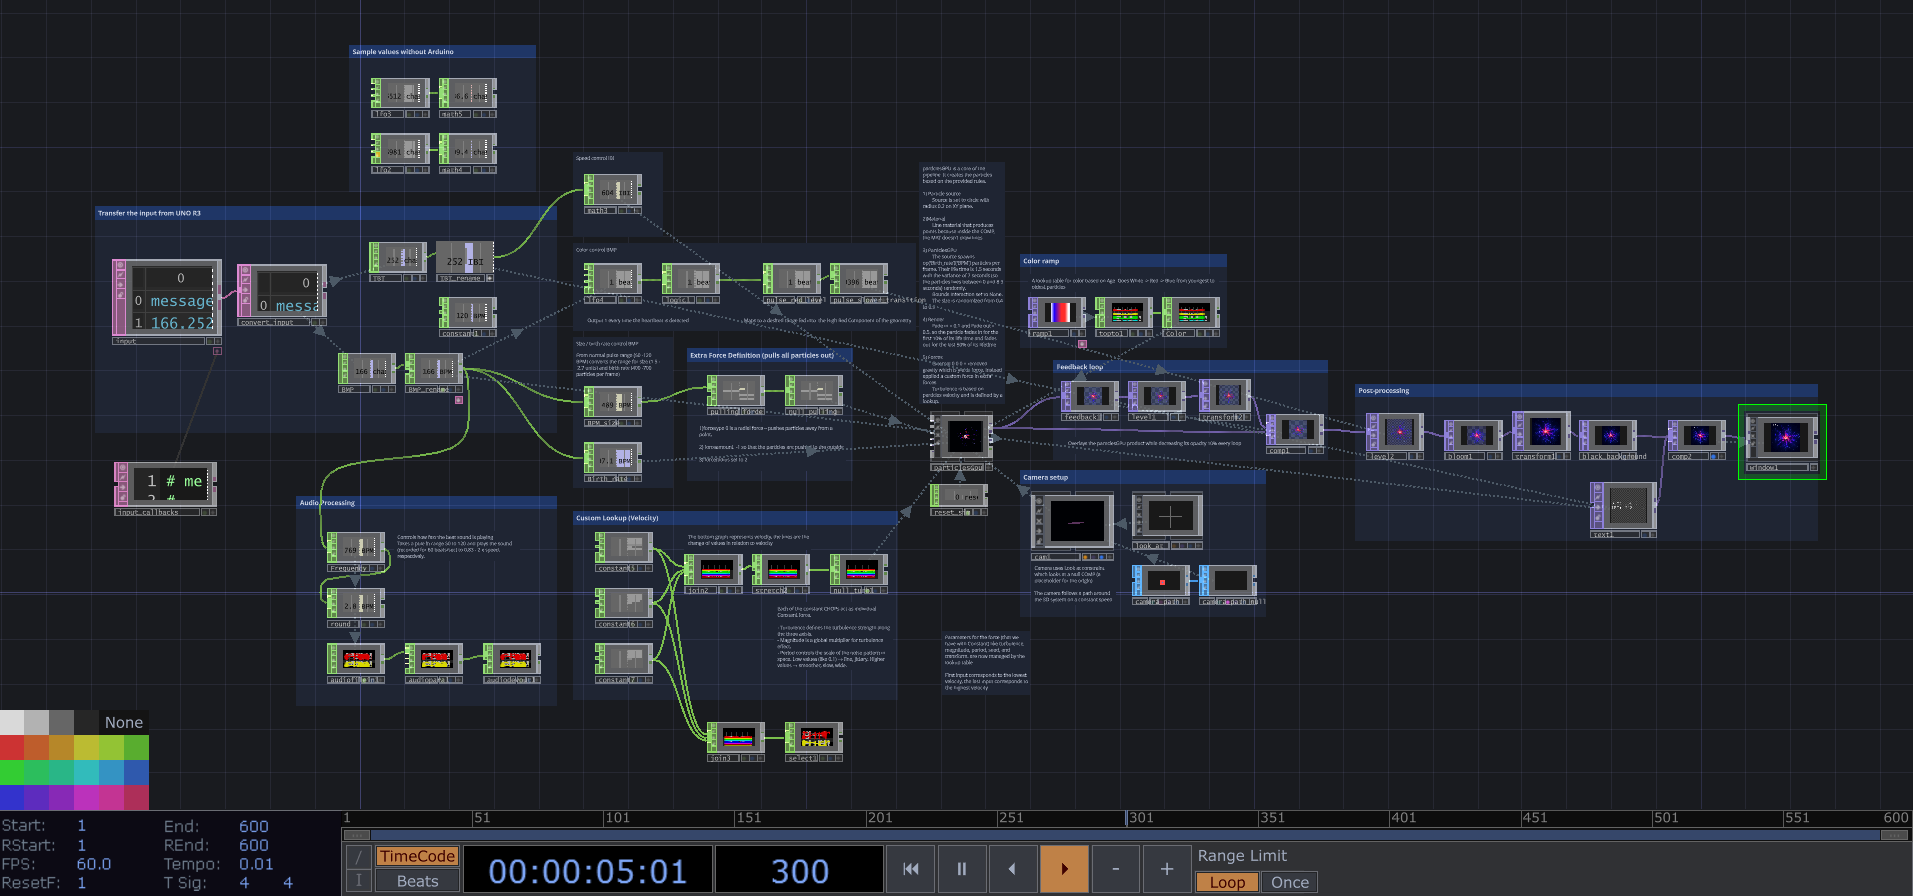
Data Processing & Visualization
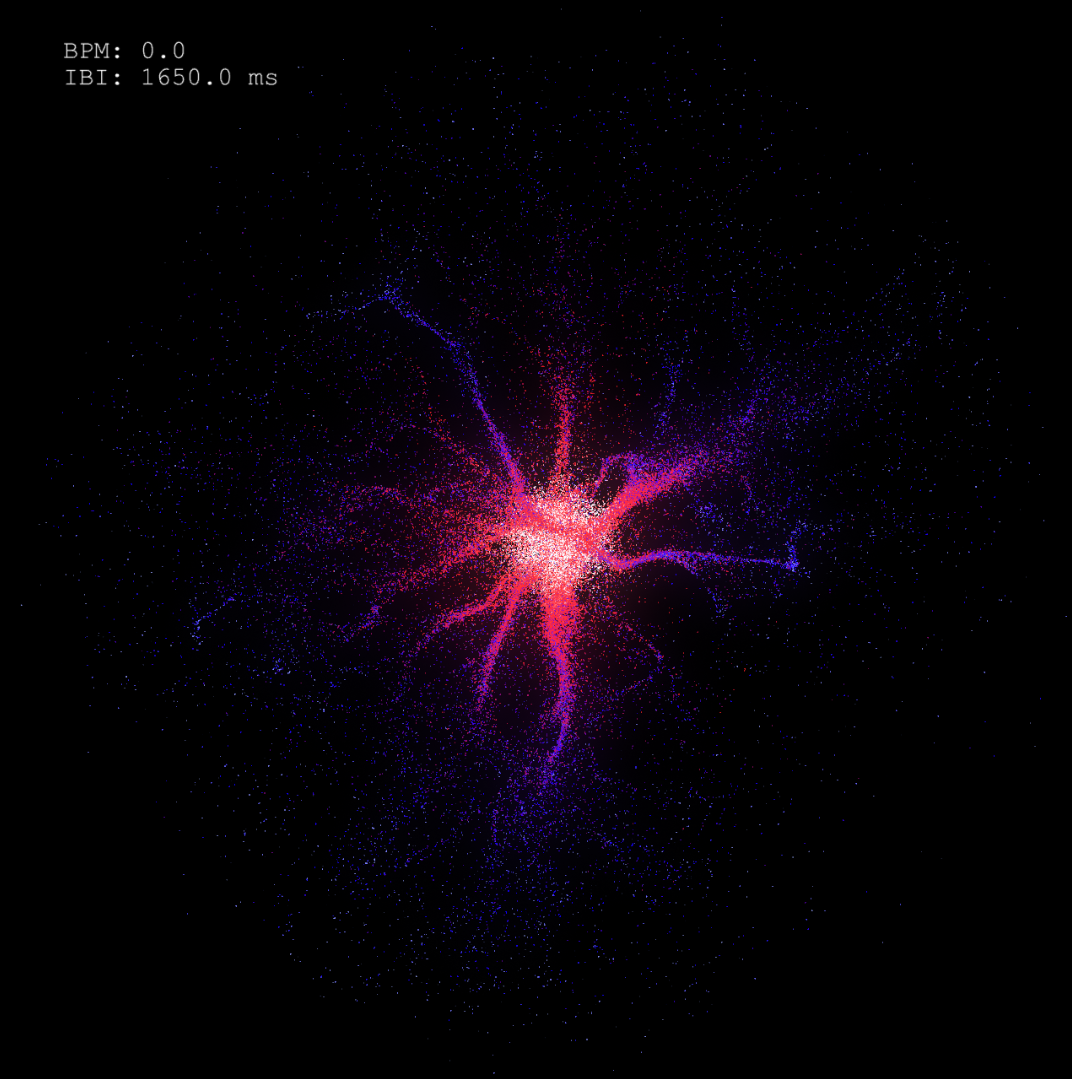
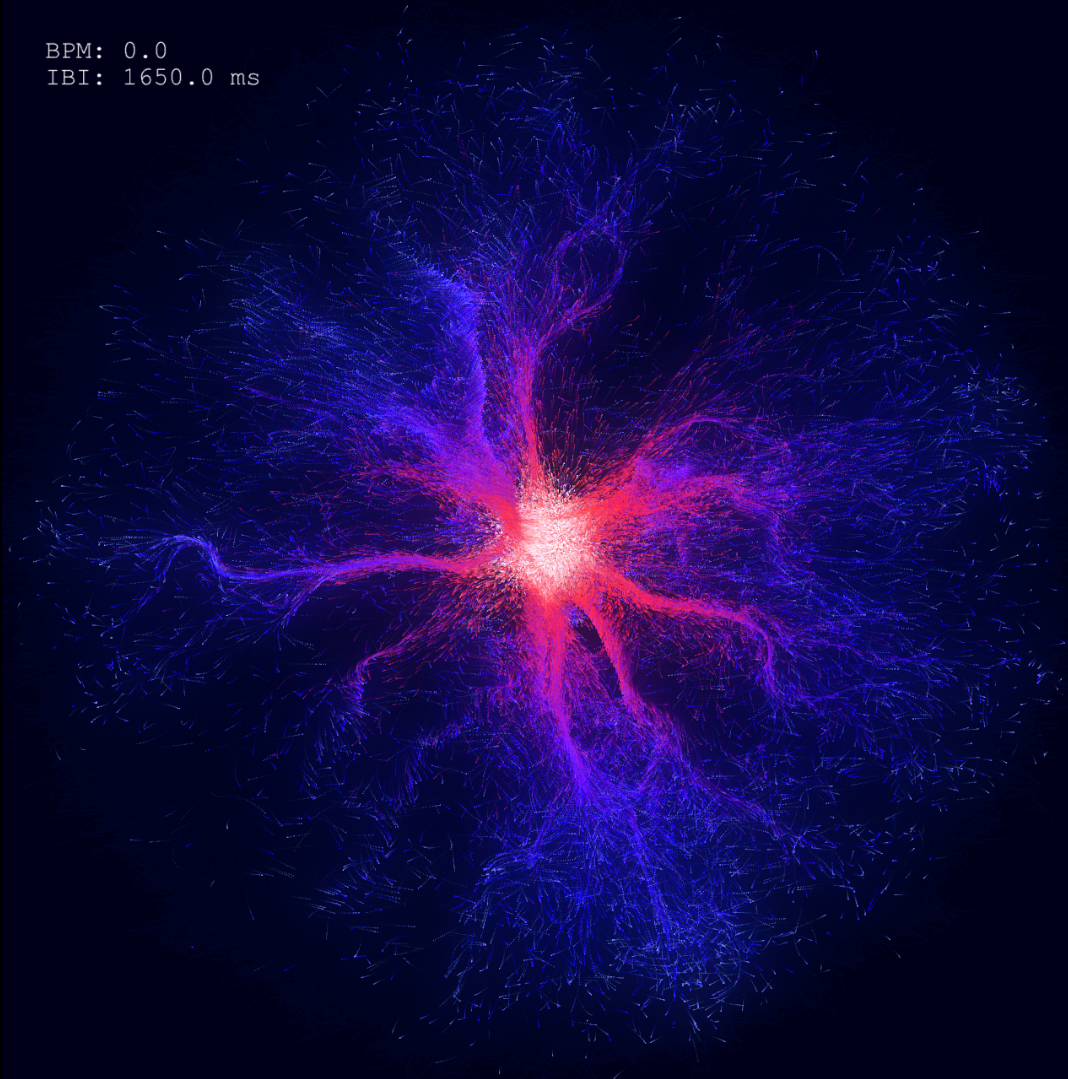
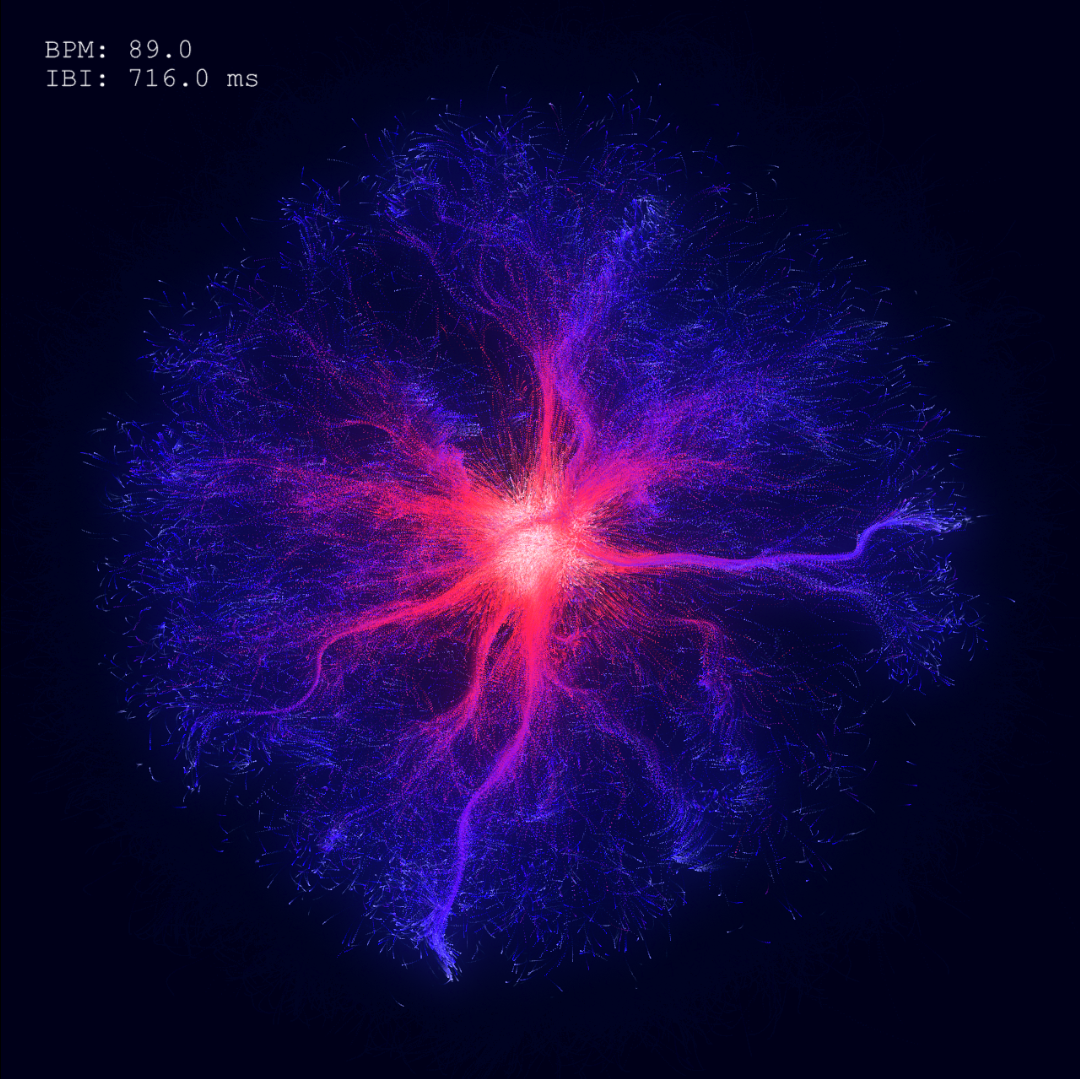
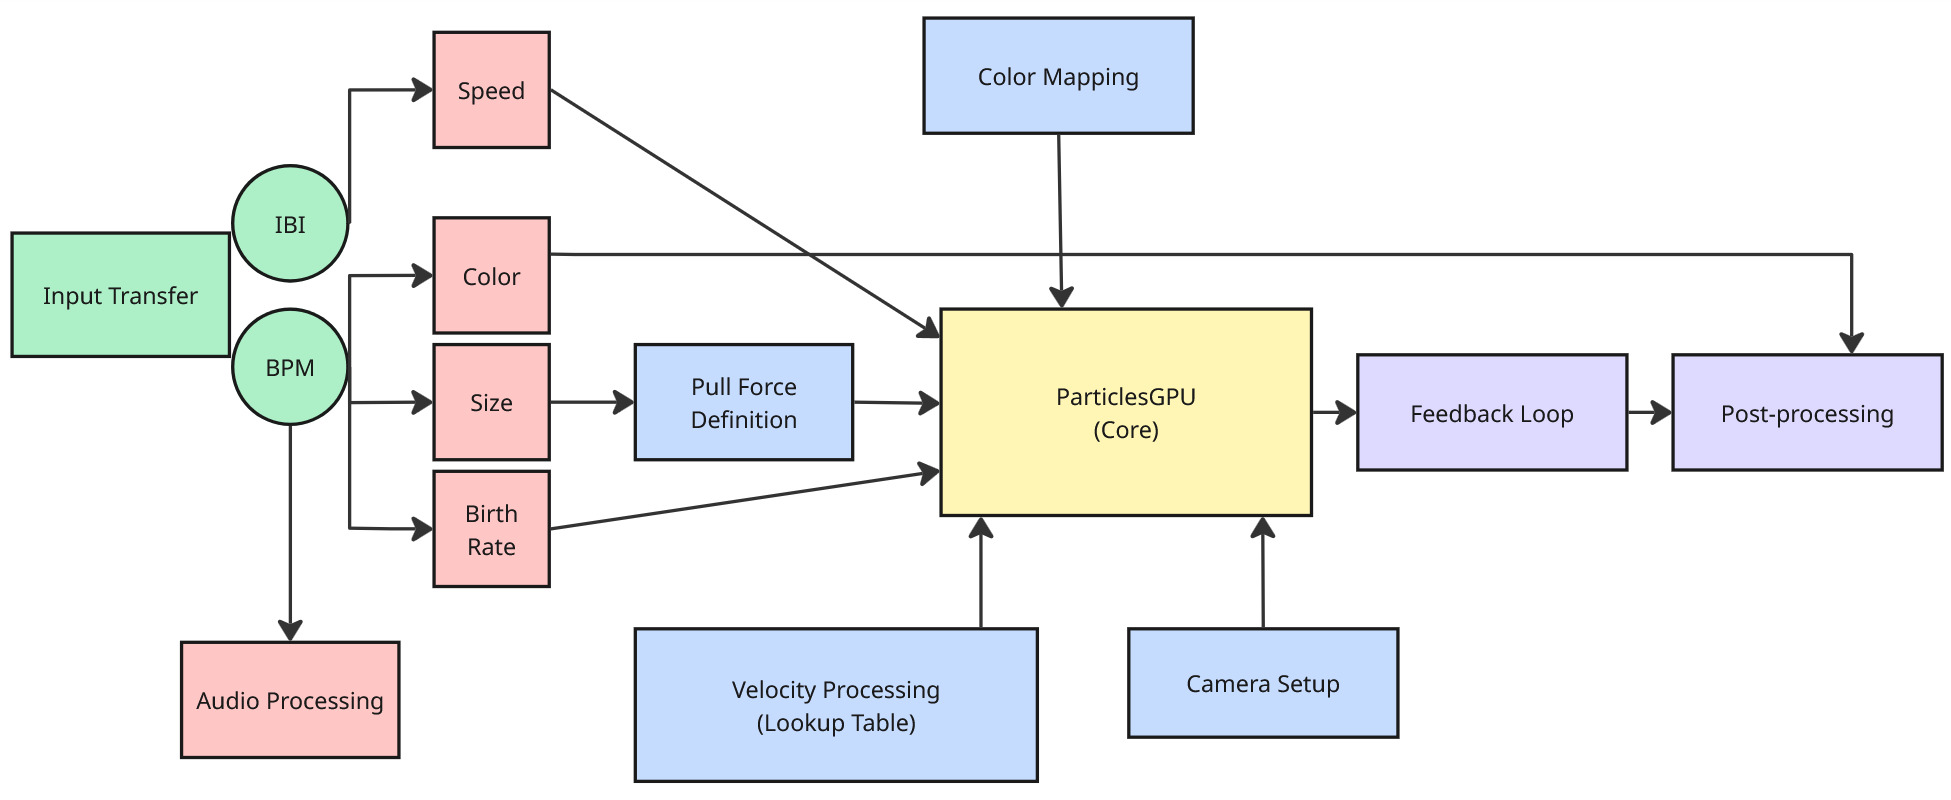
In TouchDesigner, the ParticleGPU node drives the visuals. It spawns particles, applies forces, and maps heartbeat data onto movement, color, and audio.
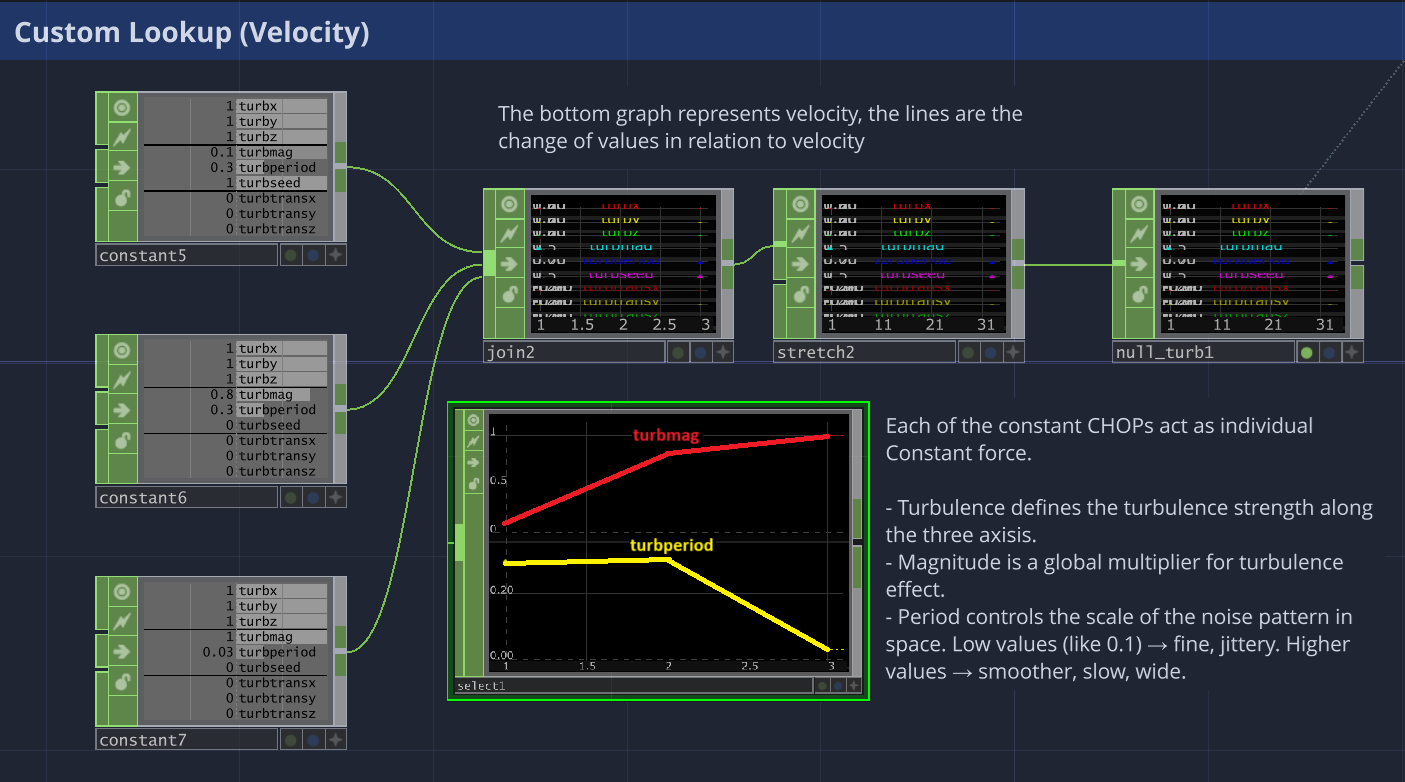
Custom Velocity Lookup Table
One highlight is the custom velocity lookup table. This defines how turbulence changes as particles speed up:
Relevance
This work is applicable in education, healthcare, and immersive installations. In education, the system transforms abstract physiological data into visuals and sounds that students can intuitively grasp. In healthcare, the approach can support biofeedback and mindfulness by giving patients immediate, sensory ways to monitor and regulate their own physiological signals. In immersive art, it creates interactive environments where audiences can literally “see and hear” their bodies in real time, fostering personal connection and curiosity.
Supports accessibility. Many audiences, including children, neurodiverse learners, and people with low literacy or vision impairments, can struggle with numbers, graphs, or text. My approach offers non-numerical, non-textual, representation of data, which reaches broader and more diverse audiences.
Future Directions
As I continue my research I plan to firstly, expand the physiological inputs using the Arduino and proximity sensor, depth camera to track body movements hand gestures. Secondly, I want to conduct studies among students and professors to measure understanding, reflection, and engagement. This will help me assess the real impact my project can have in different sectors. Finally, I want to encourage cross-disciplinary collaborations in the field of arts and science. I would like to work with scientists and artists to refine mappings between data and expression.
Challenges and learning outcomes
One of the main challenges in this project was achieving a stronger sense of depth in the particle system.
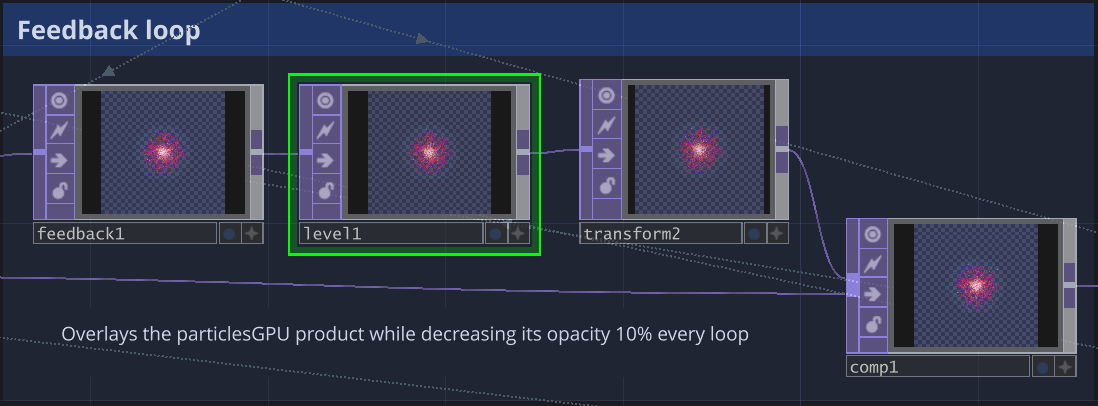
Initially, the particles generated by the Particle GPU appeared too flat, existing on a single visual layer. I wanted the structure to feel more three-dimensional and volumetric without losing the delicate branching form I had already built. Increasing the birth rate added density but didn't create the illusion of space I was aiming for. The solution was to introduce a feedback loop that layers each frame with slightly reduced opacity—about a 10% decrease per frame—creating subtle visual trails that accumulate over time. This approach gave the particles a soft, immersive depth effect while preserving the original geometry and overall flow of the system.